When it comes to picking stocks, investors often feel like they’re searching for a needle in a haystack. With thousands of companies to choose from, how do you know which ones are worth your money?

Enter the price-to-earnings ratio, or P/E—a simple yet powerful metric that’s been a cornerstone of stock analysis for decades. Whether you’re a beginner building your first portfolio or a seasoned trader hunting for value, the P/E ratio can help you cut through the noise. But what does it really tell you, and how can you use it effectively?
What Is the P/E Ratio?
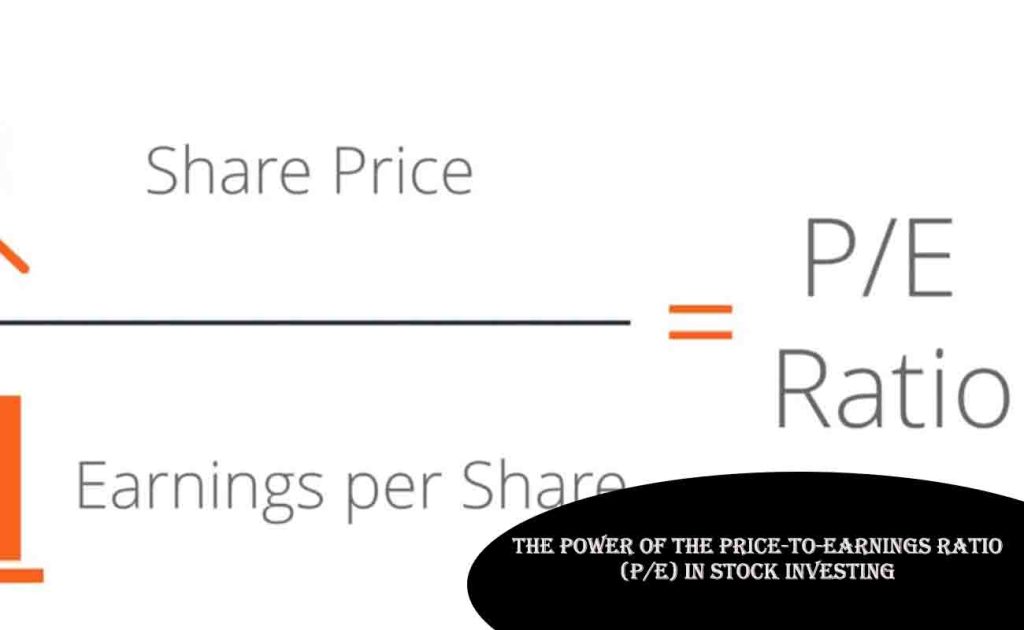
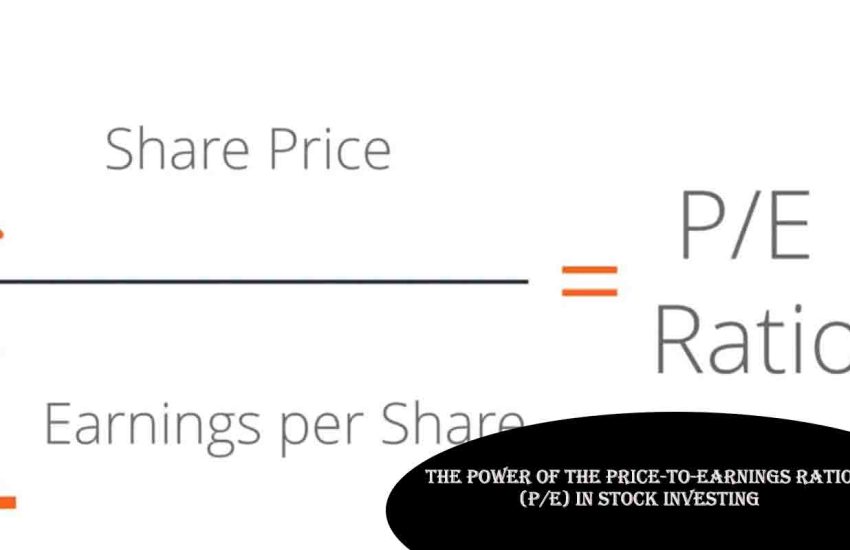
The P/E ratio measures a company’s stock price relative to its earnings per share (EPS). The formula is straightforward:
P/E = Price per Share / Earnings per Share
For example, if a company’s stock trades at $50 per share and its EPS over the past year is $2, its P/E ratio is 25. This means investors are willing to pay $25 for every $1 of the company’s earnings. Think of it as a price tag on profitability—how much are you shelling out for a slice of the company’s bottom line?
High vs. Low P/E: What It Signals
A stock’s P/E ratio isn’t just a number—it’s a story. A high P/E (say, 30 or above) often suggests that investors expect strong future growth. Tech giants like Amazon or Tesla frequently sport lofty P/Es because the market bets on their innovation paying off down the road.
On the flip side, a low P/E (below 15, for instance) might indicate an undervalued stock—or a company with stagnant growth. Mature industries like utilities often have lower P/Es, reflecting stability rather than explosive potential. Context matters: a high P/E isn’t always “overpriced,” and a low P/E isn’t always a bargain.
Using P/E to Compare Companies and Industries
The real power of P/E shines when you use it to compare. Looking at a single stock’s P/E in isolation is like judging a book by its cover—you need a benchmark. Compare a company’s P/E to:
- Its Industry Average: A P/E of 20 might be steep for a retailer but a steal in tech.
- Its Competitors: If Company A’s P/E is 25 while a rival’s is 15, dig deeper—why the premium?
- Its Own History: A rising P/E could signal growing confidence; a falling one might hint at trouble.
For instance, if the average P/E for the S&P 500 is 22 and your stock’s P/E is 10, it might be undervalued—assuming its fundamentals are solid.
Limitations of P/E
The P/E ratio isn’t flawless. Earnings can be manipulated through accounting tricks, and EPS doesn’t account for debt or cash reserves. A company with a low P/E might be cheap for a reason—like looming lawsuits or declining sales.
Market sentiment also skews P/E: during bubbles, inflated ratios reflect hype, not reality. Pair P/E with other metrics—like debt-to-equity or return on equity—for a fuller picture.
The Bottom Line
The P/E ratio is like a compass for navigating the stock market—it won’t tell you exactly where to go, but it points you in the right direction. By revealing how much you’re paying for earnings, it helps you spot opportunities and avoid traps.
Is that high-flying stock worth the hype? Is that overlooked gem a hidden winner? P/E gives you a starting point to answer those questions. So next time you’re eyeing a stock, check its P/E—and let it guide you toward smarter, more informed investing.
